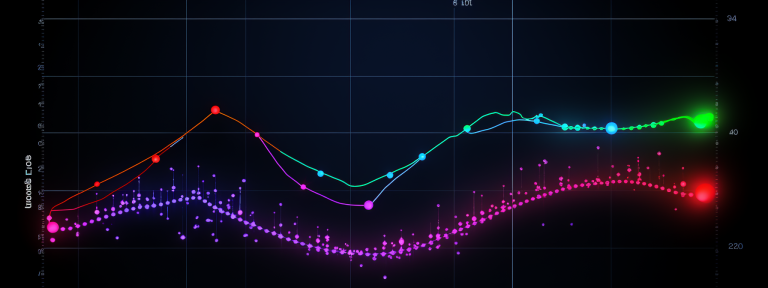
In the modern era of data analysis and visualization, there are many types of charts available to display data effectively. However, making the correct choice of chart type remains a significant challenge. Understanding the unique strengths, characteristics, and appropriate context of usage for each chart type is fundamental to effective communication. One such tool at our disposal is the line chart. Keep reading to learn more about its significance.
Understanding Line Charts
Line charts, otherwise known as line graphs or line plots, are graphical representations of data that display information serially over time. They are perfect visual tools for showing continuous data over time, set against a common scale.
The line chart makes data trends visibly apparent and allows for a high level of comparison between different data sets. Despite their simplicity, the value of these charts in identifying patterns and predicting future trends cannot be overstated.
Line charts are especially useful when you want to see the rate of change: they can show trends, patterns, and fluctuations in data over time, providing a clear visual comparison between different periods. Additionally, the simplicity of line charts in incorporating multiple variables on a single chart aids with data-informed decisions.
All in all, they are a preferred choice for simplicity and straightforwardness in effectively communicating data.
The Key Components of a Line Chart
Alt text: An image shows an example of a line chart
A line chart consists of a series of data points connected by a line, usually with markers to indicate individual data points. The x-axis (horizontal line) typically represents time, while the y-axis (vertical line) represents the measured value.
The line connecting the data points helps viewers trace the movement or direction of data over time, identifying peaks and troughs. Additional lines can be added to the chart to compare different data sets. This provides a high level of comparability, as you can visually contrast different data series within the same chart.
Ideal Scenarios for Utilizing Line Charts
Line charts are best used for data that is serially ordered, such as time-series data. They are ideal for showing trends and patterns over time. Some common examples include tracking a company’s profits over several years, monitoring average monthly temperatures, or comparing the population growths of different countries.
They are also useful in financial analysis for spotting market trends and are extensively used in tracking stocks and currencies. However, line charts may not be the optimal choice for data sets with missing values or if time-series data isn’t involved.
Line Charts in Business
Alt Text: A line chart shows financial data
In the business context, line charts are invaluable for tracking key performance indicators over time. For instance, sales, revenue, customer acquisition costs, and other vital data can be monitored effectively through line charts.
Line charts help business leaders spot both positive and negative trends, enabling them to make informed strategic decisions for the company’s future. Line charts also allow users to discern potential future trends based on historical data. By accurately predicting these trends, businesses can seize opportunities before their competitors and respond proactively to potential challenges.
Thus, line charts can be an essential tool for enhancing business performance and gaining a competitive advantage in the marketplace.
Line Chart Vs. Other Chart Types: Making the Right Choice
Line charts, bar charts, and pie charts are the most commonly used chart types. However, they each serve different purposes. It’s crucial to understand their differences and make an informed decision when choosing the right chart for your data presentation.
While line charts are best for showing trends over time, bar charts excel at comparing categorical data. Pie charts, on the other hand, are optimal for depicting percentage or proportional data.
Overutilization or inappropriate usage of line charts may lead to data misinterpretations, and it’s essential to consider other chart types when specific situations call for it. Understanding the distinctive strengths of each chart type and selecting appropriately is the key to an effective data visualization strategy.
Overall, line charts are a versatile and powerful data visualization tool for both understanding and analyzing data. They offer a straightforward way of understanding trends, making comparisons, and predicting future changes. Regardless of their simplicity, the value they add to data analysis and business decision-making is immense.
Link builder, Marketing Advertising specialist at SEO, done work on many site through guest posting. Have 5 year of experience in Guest posting. Email: talhalinkbuilder@gmail.com Whatsapp: +923421747707


0 Comments